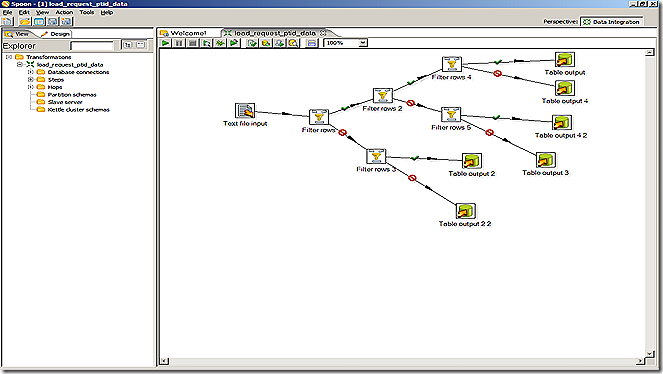
In this post I’ll discuss about “"How to Create Mapping/Transformations with Kettle”. I needed to load set of flat files into database staging area for my staging ETL. I created the mapping for this using various Kettle transformations (I don’t know why Kettle doesn’t call a set of related transformations as Mapping, like Informatica ).
I used the Text file Input Transformation to read the tab separated data. Then using various filter transformations I extracted the relevant data and loaded into an database staging table.
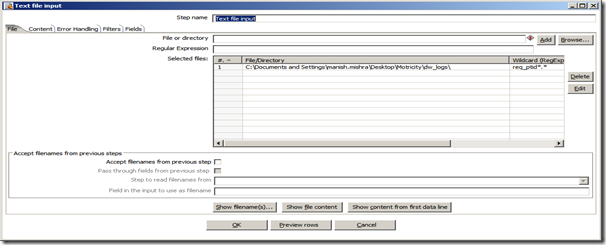
Drag an Text file Trans from Input Trans category, from Explorer Tab, to mapping area. Configure the Text file Trans to get the source data. Configuration includes file directory location, Regular expression for file name, Data Separator and Field formatting etc.
Next step is to add filter Trans, to select relevant data from Flat file. Filter Rows Trans is listed under Utility Category in Explorer Tab.
Now we need to join two transformation, like Text file Trans to Filter Rows, you need an Hop. Just select the Trans , from which data flow will begin, press middle click with your mouse and drag the mouse to the Trans where finally data will pass.
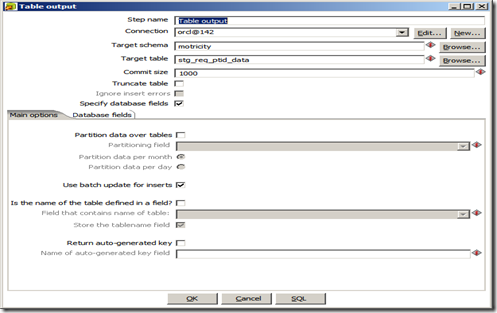
Lastly after number of Filter Trans, we get the desired staging data, which we need to Insert into the database table. For this we drag an Table Output Trans from Output Category in Explorer Tab. You need to configure the Trans to connect it to respective table in Database, which requires database connection information and the table name. You need to check that whether your Kettle version has relevant database drivers installed under “$Kettle_Root_Dir\data-integration\libext\JDBC\”. If not then you won’t be able to connect to the database. For this you need to copy the respective drivers to the above location. For example I had to copy “ojdbc14.jar” for Oracle connection.
After this you need to verify the mapping which you’ve created. You can do this by pressing “F11” or use Tool bar button. Once you’re done with verifications then you can test the mapping execution by using Toolbar. Either you can Play this Trans or Preview.
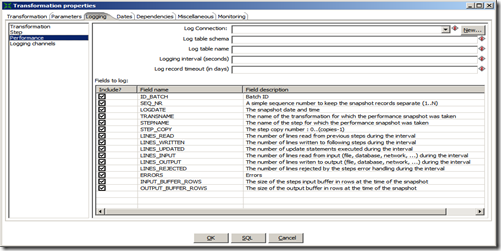
In this console you can view all the Trans, used in the mapping and their statistics. Kettle gives you the facility to debug the mapping as well. For Debugging you need to use the Configure option. This functionality again compares Kettle with the Informatica. You can select the logging level as well. The thing which I liked most was the Performance Graph functionality, which can be really beneficiary while working with large volumes of data. You can log all the session details in a database repository as well. Only thing lacking here is the Metadata reporting which Kettle doesn’t provide.
You can view all the Execution related metrics like Rows Read, Updated, Deleted or Inserted for each Step in the “Step Metrics” tab under Execution results Tab, which you can select from Toolbar.
In the Next post I’ll discuss on how to Create and Execute Kettle Jobs.


